 |
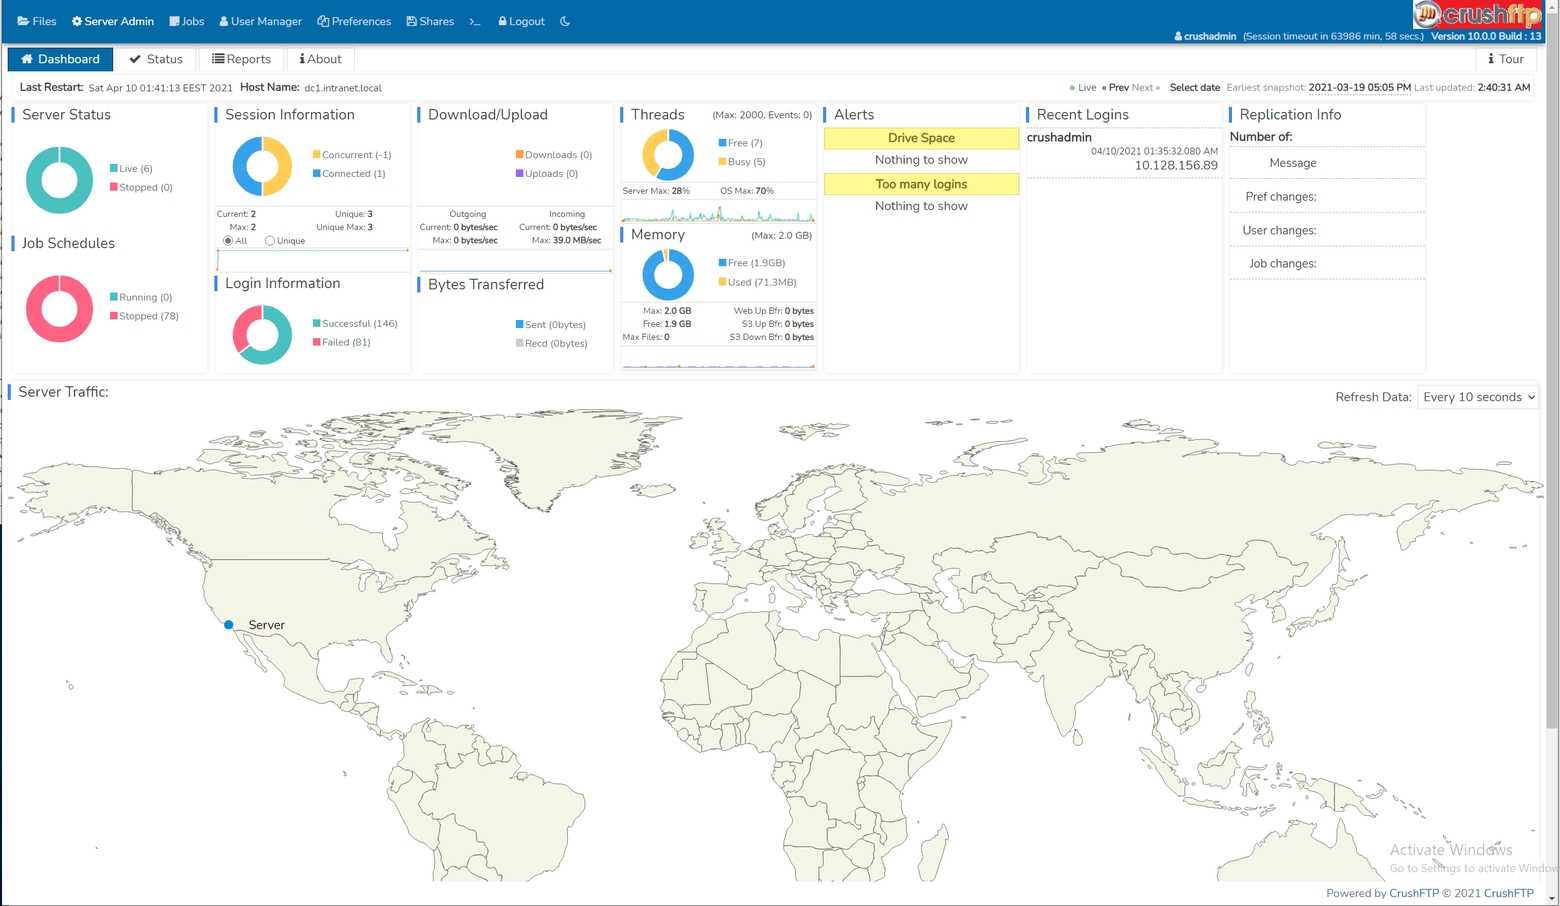
Most of the dashboard widgets names are self explanatory:
- Server Status
- shows the status of the server listener configured on the IP/Servers page
- Job Schedules
- displays the number of existing Jobs and their current running state
- Session Information
- user sessions
- Login Information
- basic statistics about user login states
- Download/Upload and Bytes Transferred
- traffic volume related statistics
- Threads
- the number of active (busy) and recently released (free) threads within the sampling time window
- CPU Usage Graph
- usage of the host CPU and the virtual JVM CPU
- Memory
- JVM heap usage and upper limit
- Recent logins
- most recent user sessions within the sampling time frame
Some more special widgets:
- Alerts
- by default, not animated. Need to add in first a Drive space and/or a Too many logins type alert on the Alerts config page
- Replication info
- by default, not animated. Meaningful only in a cluster scenario with Replication enabled.
- Server Traffic
- by default, not animated. When it is enabled, displays user geoip statistics. Requires an active subscription for Ipstack's free geolocation API
 at least, and requires outbound Internet access to their API hosts as prerequisite, to function. The API key is to be applied on our Misc config page.
Add new attachment
Only authorized users are allowed to upload new attachments.
List of attachments
| Kind | Attachment Name | Size | Version | Date Modified | Author | Change note |
|---|---|---|---|---|---|---|
jpg |
dashboard.jpg | 448.1 kB | 3 | 09-Apr-2021 19:42 | Ada Csaba | |
jpg |
dashboard1.jpg | 448.1 kB | 1 | 09-Apr-2021 19:42 | Ada Csaba |
«
This page (revision-27) was last changed on 10-Apr-2021 01:35 by Ada Csaba
G’day (anonymous guest)
Log in
CrushFTP10 | What's New
- WebInterface
- Server Admin
- User Manager
- Client Apps
- CrushBalance Load Balancer
- High Availability
- Self Registration
- Preferences
- Email Templates
- Restrictions
- Replication
- Banning
- Logging
- Encryption
- Alerts
- Folder Monitor
- Tunnels
- Syncs
- User Config
- Search Config
- Preview
- Misc
- Plugins
- FAQ
- API
- Linux Install
- Virtual Linux Server
- Server Variables
- Google Authenticator and Microsoft Authenticator
JSPWiki