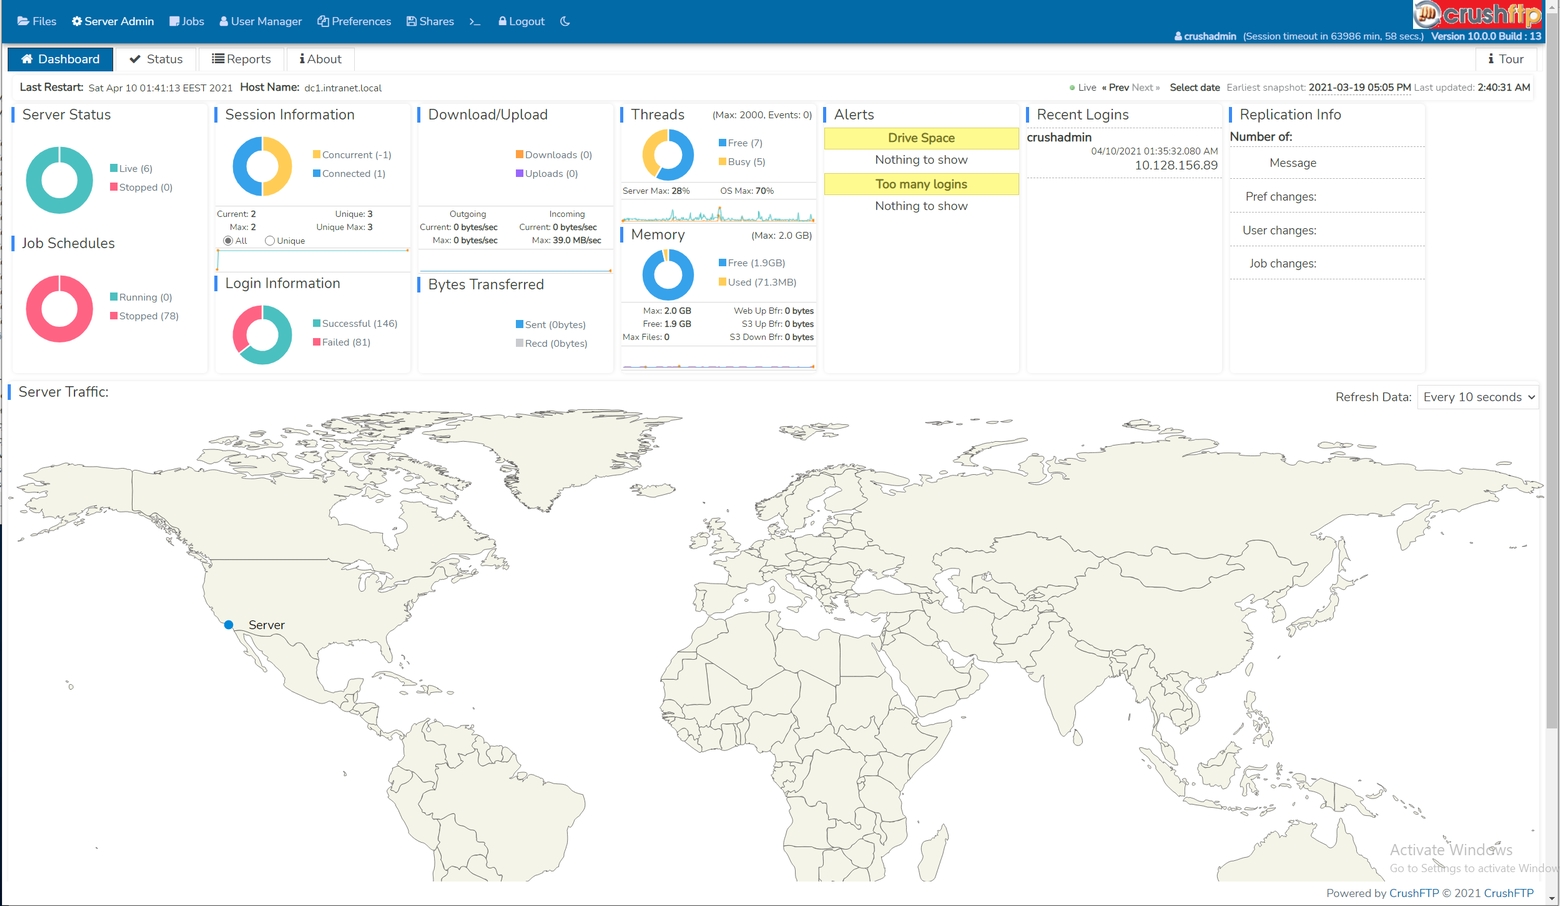
Server Dashboard displays server status info
 |
Most of the dashboard widgets names are self explanatory:
- term
- definition text
Server Status: shows the status of the server listener configured on the IP/Servers page Job Schedules: displays the number of existing Jobs and their current running state Session Information: user sessions Login Information: basic statistics about user login states Download/Upload and Bytes Transferred: traffic volume related statistics Threads: the number of active (busy) and recently released (free) threads within the sampling time window CPU Usage Graph: usage of the host CPU and the virtual JVM CPU Memory: JVM heap usage and upper limit Recent logins: most recent user sessions within the sampling time frame
Some more special widgets:
Alerts: by default, not animated. Need to add in first a Drive space and/or a Too many logins type alert on the Alerts config page
Replication info: by default, not animated. Meaningful only in a cluster scenario with Replication enabled.
Server Traffic: by default, not animated. When it is enabled, displays user geoip statistics. Requires an active subscription for Ipstack's geolocation IP services https://ipstack.com/product ,and requires outbound Internet access to their API hosts, to function. The API key is to be applied on our Misc config page.
Add new attachment
List of attachments
| Kind | Attachment Name | Size | Version | Date Modified | Author | Change note |
|---|---|---|---|---|---|---|
jpg |
dashboard.jpg | 448.1 kB | 3 | 05-Dec-2023 05:32 | Ada Csaba | |
jpg |
dashboard1.jpg | 448.1 kB | 1 | 05-Dec-2023 05:32 | Ada Csaba |
